Better Practices for Teaching Business Analytics
Taxonomy for academic institutions’ program and course offerings
Demystifying Business Analytics Terminology
There is no universally-accepted definition for analytics – some are broad and inclusive; some are narrow and focused on certain capabilities. Although the scope of these definitions may be seemingly different, the underlying theme and purpose are the same, which is to turn data into actionable insight to make better and more timely decisions [3]. Often depicted as a process, analytics uses the enablers of many disciplines (led by statistics, machine learning and operations research) in this scientific journey of discovering new and novel knowledge for solving previously deemed unsolvable problems. Simply put, analytics is the art and science of marrying data and math to solve problems and make optimal decisions.
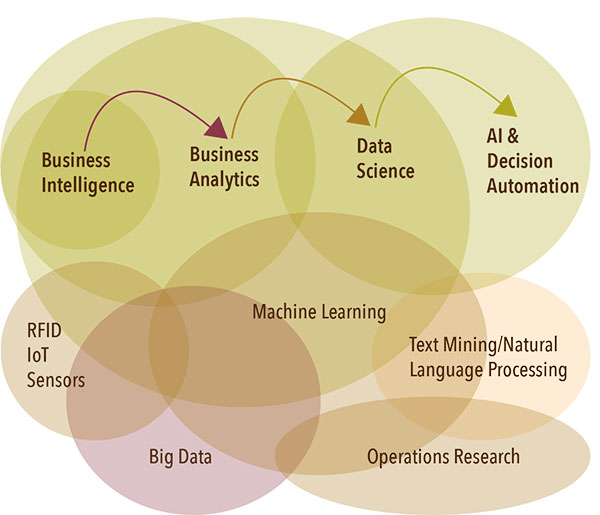
Over the years, analytics has taken on different names and “buzzwords,” therefore the proper understanding of the underlying phenomenon warrants some delineation. Among these terms are business intelligence, business analytics, data science and artificial intelligence (AI) [4]. In addition, terms such as big data, machine learning, Internet of Things (IoT), natural language processing, among others, are more the enablers of analytics. Figure 1 attempts to propose some structure to the underlying complexity of these terms, using a relatively simple Venn diagram.

To better portray the name changes over time, a timeline is provided in Figure 2, where the progressive terminology used to describe analytics since the 1970s is depicted. The proposed changes in the terminology are portrayed at the top, while corresponding enabling technologies are listed at the bottom.

Among all of these terms, the two that are most often used interchangeably are business analytics and data science. Are they the same? If so, why do we have two different names for the same concept? For this article’s purpose, these terms are the same; both aiming to transform data into information and actionable insights through an algorithm-based discovery process. The differences are usually observed at the scope dimension. Similar to the scope enlargement we witnessed moving from business intelligence to business analytics, we are now experiencing yet another scope enhancement moving from business analytics to data science. While business analytics adds predictive and prescriptive modeling on top of business intelligence, data science adds big-data enablers, low-level programming (e.g., Python, R, SQL/NoSQL, JavaScript, Perl), and advanced machine learning (i.e., deep learning and its variants) [5]. Another difference can be observed in each application domain and the tools employed; business analytics deals with business problems using workflow-type tools and readily available algorithms, and data science deals with a broader range of problems using low-level programming and enhanced algorithm and custom solution development processes.
Furthermore, there are observed differences in the use of these two terms – business analytics and data science – in higher education degree programs. Business schools offering certificate and graduate/undergraduate degree programs typically title their offerings business analytics, while computer science, statistics and industrial engineering schools are offering similar programs under the name of data science. A quick look at these curricula reveals that while business analytics programs are more applied, problem-solving and high-level methodology focused, data science programs focus on programming, algorithm development and low-level methods. While these observations are generally valid, they are not universally applicable, standardized or uniformly practiced.
Driving Forces Behind Business Analytics Programs
After more than a decade, the popularity of analytics-related degree and certificate programs in academia only continues to increase. In recent years, we have witnessed the advent of hundreds of educational programs in the United States, Europe, Far East and other countries by both degree-awarding, well-established universities and non-degree focused (mostly offering online, asynchronous classes), newly created educational platforms [6]. This increased interest in analytics programs is mostly driven by the continually growing demand from employers [7].
There are myriad articles about analytics and how analytics is destined to change the world by changing the way managerial decisions are made. Analytics has become a new label for evidence-based management (i.e., evidence/data-driven decision-making) [8]. All types of organizations are interested in employees equipped with analytics skills. But why has analytics become so popular in the industry and subsequently in academia? And why now? The reasons (or forces) behind this popularity can be grouped into three main categories: need, availability and affordability, and culture change [4, 7].
Need for better decisions. Conducting business is anything but “as usual” nowadays. Competition has been progressively transformed from local to regional, to national, and now, global. The protections created by tariffs and logistic costs that sheltered companies in their geographic regions are no longer as prominent as before. In addition to increased global competition, and perhaps because of it, customers have also become more demanding – asking for the highest quality products and services at the lowest prices and fastest delivery. Therefore, the need for fact-based, accurate/optimized and timely decisions is more critical than ever before. Analytics is promising to provide managers with the insights they need to make better and faster decisions.
Availability and affordability of enablers. Thanks to recent technological advances and the affordability of software and hardware, organizations are collecting tremendous amounts of data. IoT data collection systems – based on a variety of sensors and RFID technologies, internet and social media sources – have significantly increased the quantity and quality of data. In addition to the ownership model, cloud solutions and software- (or hardware-) as-a-service business models allow businesses (especially small to medium-sized businesses with limited financial power) to lease analytics capabilities and pay only for what they use [9].
Culture change. There has been a shift from traditional, intuition-driven decision-making to contemporary, evidence-based decision-making at the organizational level. Most successful organizations have made a conscious effort to shift to data-driven business practices. Because of the availability of data and supporting information systems infrastructure, such a paradigm shift is taking place faster than many thought possible. As the new generation of quantitatively savvy managers replaces the baby boomers, this evidence-based managerial paradigm is expected to accelerate.
A Taxonomical View to Characterizing and Teaching Business Analytics
As interest in adopting analytics grows, the need for a better definition and characterization of the underlying concepts into a simple taxonomy has emerged. Such a taxonomical structure could create a common understanding and definition for its practitioners, eliminate myths and misconceptions, and provide a framework for developing more effective analytics curricula.
About a decade ago, several well-known consultancy companies (e.g., IBM, SAS, Gartner, Accenture, IDT, among others) and international institutions embarked on a mission to create such a simple taxonomy for analytics. One of the institutions that embarked on this journey was the Institute for Operations Research and the Management Sciences (INFORMS). To gain a broad perspective of industry and academia and a holistic representation of the underlying concepts, INFORMS hired Capgemini, a strategic management consulting firm, to conduct a study to define and characterize analytics, and potentially create a simple taxonomy [10]. The study proposed a common definition for analytics wherein they identified three consecutive and somewhat overlapping levels/echelons: descriptive, predictive and prescriptive.
Descriptive analytics is the initial stage in the analytics continuum. It is often called business reporting because most of the analytics activities at this level deal with creating on-demand reports to summarize business activities to answer, “What happened?” and “What is happening?” An extension of descriptive analytics, often titled diagnostic analytics, is also part of this taxonomical representation. It is worth noting that some depictions of analytics taxonomy show diagnostic analytics (which aims to answer the question “Why did it happen?”) as a separate echelon in between descriptive and predictive layers. However, the original three-tier depiction, where diagnostic is an extension of descriptive analytics, is more widely accepted. Descriptive analytics is also called business intelligence, and predictive and prescriptive analytics together are called advanced analytics.
Predictive analytics follows descriptive analytics, where the goal is to look beyond what happened and try to answer the question, “What will happen?” Using a variety of forecasting and machine-learning techniques, predictive analytics aims to make scientific estimates about the future values of any variables of interest. If what is being predicted is a categorical variable, the act of prediction is called classification; otherwise, it is called regression. If the predicted variable is time-dependent, the prediction process is often called time-series forecasting.
Prescriptive analytics is the last tier in the analytics continuum, where the best alternative among many courses of action (identified through predictive and descriptive analytics) is determined using logical and mathematical models. It aims to answer, “What should I do?” by utilizing O.R. methods (e.g., optimization, simulation and heuristics-based decision-modeling techniques). The methods behind prescriptive analytics are not new; most of the underlying methods were developed in the 1940s during World War II when there was a dire need to achieve the best results using limited available resources.
Academic institutions can use this simple taxonomy to streamline certificate and degree program offerings in a logical and proven manner (see sidebar below). The survey of current academic offerings shows that there is a wide variety of curriculum configurations adopted by universities, colleges and academic departments. Some curricula are more technical, programming and algorithm focused, while others are more managerial, problem and implication focused. This is expected because departments and colleges desire to teach what they think their students should know to be competitive in the job market.
Another reason for such disparity in analytics offerings is driven by the lack of time and proper teaching resources. Because of the rapidly emerging popularity of analytics in business circles, academic departments were asked to respond to the demand by quickly designing and offering analytics-related certificate and degree programs, and were often asked to do this without adding any new faculty. Therefore, instead of taking a foundational and revolutionary approach to design the most appropriate degree programs with new courses, institutions transformed most of their existing course offerings under analytically flavored titles with minimal change in content. This practice of repackaging existing courses leads to less than ideal configurations of analytics programs.
A Structured Course Schedule for Business Analytics
The following course structure is designed and proposed based on the author’s 30+ years of experience as a consultant, university instructor and advisor, analytics textbook author and mentor to several institutions in the U.S. and abroad. Given the genuine interest to develop the best possible curriculum and the availability of needed resources, a business analytics or data science (BA/DS) graduate degree program can be designed as follows.
Preamble
- An overview class to introduce BA/DS as the new way of making smart managerial decisions. A motivational overview of underlying concepts and topics with interesting high-level case studies. It may also include flavors of the human decision-making processes (Simon’s model from the 1980s).
- An introduction to analytics programming class (R or Python, if desired).
Descriptive Analytics
- A class on the nature of data and simple statistics (primarily covering descriptive statistics and some inferential statistics).
- A class on SQL, relational databases and data warehousing.
- A hands-on class on data visualization insights and best practices using any combination of Excel, Tableau, PowerBI and SAS Visual Analytics.
Predictive Analytics
- Data mining: covering the process and different pattern recognition methods (prediction, including time series prediction, clustering, association, network modeling/mining).
- Text mining: web and social media mining (both content and structure perspective).
- Machine learning for predictive analytics: a best-practices-driven approach to cover the concepts and application of a rich collection of machine-learning techniques.
- Advanced analytics: big data, deep learning, explainable AI, AutoML and cognitive computing.
Prescriptive Analytics
- Optimization modeling (linear and nonlinear): the fundamental concepts of mathematical modeling with Excel Solver hands-on experiences.
- Simulation and heuristic modeling: basic concepts of simulation modeling (e.g., Monte Carlo simulation) and heuristic search methods (e.g., genetic algorithms) with Excel-based exercises.
- Multicriteria decision modeling and group decision-making basics with simple and intuitive hands-on exercises.
Wrap-up
- An analytics project-management approach to executing BA/DS projects, identifying and blending the best practices in BA/DS and PM for a better (on-time, on-budget, on-target) delivery of actionable results/insights.
- A capstone class involving end-to-end solution development for a challenging real-world problem using real data. Preferably, such a project would come from a real company, perhaps under an internship-type engagement.
Based on characteristics of the analytics offering at each academic department, additional, subject-oriented courses can be added, combined/merged, or some of the courses can be split into more specific ones.
What Tool(s) to Use for Analytics Teaching?
Parallel to the tremendous growth in analytics and data science, the landscape of software tools that can be used to apply these technologies is also evolving and expanding at an unprecedented pace [7]. There already exist numerous software tools to use for analytics and data science, ranging from commercial and paid to free, open-source tools, from visual/workflow-type to programming language-based platforms. Some software tools are cloud-based, while others require local installations, and yet some provide local installation and complement it with cloud-based platforms for computational efficiency and ease of model deployment. Tools vary in terms of data preprocessing and flexible and powerful model building, as well as ease of learning, use and deployment.
Although Python and R have emerged as “have it all” programming platforms for analytics and data science, they also have their shortcomings, largely related to their broad and unverified collection of sources/libraries and over-reliance on syntactic programming structures. Most business analytics and data science professionals tend to use a portfolio of software tools and programming languages collectively and synergistically to produce the best possible outcomes for a given data science project. Mathematical and statistical knowledge of the underlying algorithms, experience with the most effective analytics platforms, domain knowledge and people management skills are all expected components for a superior data scientist [5]. In addition, the success of a data scientist also depends on the tools they rely on. For a successful business analytics education and subsequent employment, a good mix of knowledge and skills in popular analytics programming languages and workflow-type analytics software tools (e.g., SAS EM, IBM Modeler, KNIME, Alteryx) is necessary.
Due to the multifaceted, multidisciplinary nature of analytics, students might be hesitant to pursue a degree in it, especially if their background does not include technical or mathematical skills and knowledge. To ease entry into this seemingly technical field, that is, to make analytics learning (and teaching) easy (or easier), software-related complexities can (and should) be remedied by using a heavy dose of visual and intuitive model development platforms [11]. Having to spend less mental energy on the syntactic details of the tool could allow students and teachers to focus on the foundational concepts and best practices of analytics. There are many visual tools in the marketplace; most of them are commercial. KNIME Analytics Platform is a free and open-source visual software tool that fits very well with this teaching philosophy [12].
KNIME Analytics Platform offers one of the most comprehensive data access and processing capabilities, model building and testing functions (including ordinary machine learning as well as deep learning algorithms), data visualization and model deployment options. Although the initial installation comes with more than 2,000 native nodes (i.e., functions embedded in visual icons), if needed, one can build new nodes, use those built by the KNIME community, or integrate with the functionalities of scripting languages like Python and R.
Summary and Conclusion
Largely driven by the need to make data-driven, better and faster decisions, availability of data in large volumes and varieties, along with the advances in analytics methods and methodologies provide an unprecedented opportunity for universities to produce graduates who can address highly challenging and very interesting real-world questions. Analytics and its derivative terms have emerged as the new paradigm to shift problem-solving and decision-making from traditional practices (relying on gut feelings and limited past experiences) to modern-day executions (relying on data, evidence and mathematical sciences). Higher education institutions are now tasked to produce this new generation of decision-makers who can face today’s complex business challenges with precision and confidence.