Retention Costs in CLV
What are retention costs in the customer lifetime value calculation?
Retention costs are the marketing costs (or marketing investments) that are designed to increase customer loyalty (or decrease switching). The intention is to increase the length of time that a consumer remains a customer of the firm or brand. In theory, the longer a firm or brand can retain customers, the more profitable they become (as revenue X time/years).
There is generally a positive correlation between the length of time a consumer has been a customer of a firm or brand and the revenue generated from the customer. In other words, over time, consumers tend to increase purchases with the companies or brands that they already have dealings with or make purchases from. This is discussed in a separate article on this website – increase in customer profitability over time. This is highlighted in the following diagram.
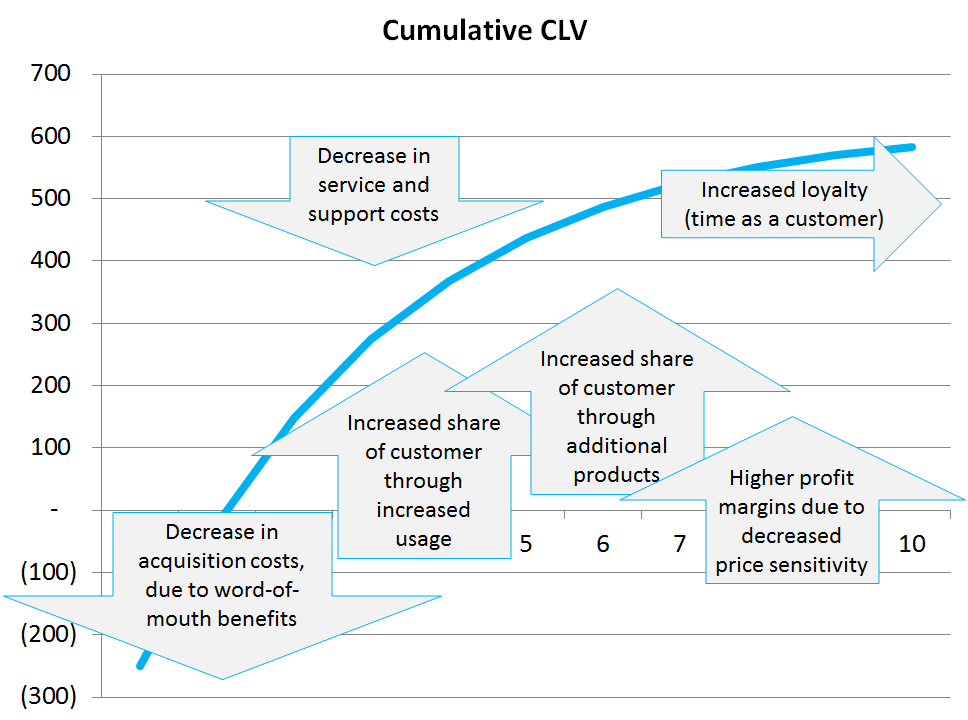
Please note that an increased in per customer revenue happens both naturally – that is, the consumer feels more comfortable and confident with the brand/firm – and it also happens through proactive marketing campaigns designed to cross sell the customer additional products. This is usually known as increasing “share of customer”.
As a result of increasing customer loyalty – the lifetime period of a customer – many firms and brands will invest heavily in retention strategies and tactics. Some of those are positive and give the consumer a rational or emotional reason to remain loyal – and some of those are negative, commonly known as a switching barrier, which makes it difficult or costly for the consumer to switch.
Firms invest quite heavily in retention and cross selling marketing activities. These activities are probably promotional but can extend across the full range of a marketing mix. All these activities, as retention or loyalty costs, are targeted at existing customers.
This is an important distinction to understand. Acquisition costs of those marketing costs targeted at non-customers in an attempt to win their business retention costs are those marketing investments targeted at existing customers. They may even attempt to reacquire lapsed/lost customers.
It is common in large companies to develop marketing programs for customer acquisition (winning new customers) and have marketing programs as well as for customer retention and up-selling.
In order to effectively and accurately calculate customer lifetime value, the firm needs to identify its range of retention/up-selling costs. One common relationship tactic is to use some form of loyalty card or frequent buyer program. But retention tactics extend far beyond just a loyalty program and also include: new products and services, newsletters, sales calls, hospitality, special events, discounts for existing customers, and so on. All these factors need to be taking into account when determining the average retention cost per customer.
Related Topics
Retention costs formula for CLV
Retention rate to average customer lifetime period
Retention Cost Formula
Take Care When Calculating Average Customer Retention Cost
The retention cost formula seems to be straightforward, but average retention costs sometimes incorrectly due to using the wrong customer base number. It is not an uncommon for the calculation to be performed using the TOTAL numbers of customers, which would be incorrect.
Therefore, care needs to be taken when using the customer retention cost formula and we need to ensure that we only consider the number of customers RETAINED in the time period.
Retention cost formula
To calculate retention costs per customer you need to identify two components:
- Total retention costs incurred during the year (or other period applicable)
- And the number of customers retained in the following year (or other period)
Therefore, the retention cost formula is:
Total retention costs / by the number of customers retained
An example of the retention cost formula
If a firm spends $1 million on various retention costs during the year and it retained 10,000 customers, then it has spent an average of $100 per customer retention and up-selling during the year.
That is, $1m / 1o,000 = $100 per customer
POTENTIAL PITFALLS OF MISUSING THE RETENTION COST FORMULA
Let’s use the same example as above; where the firm has spent $1 million on retention costs and has retained 10,000 customers. But let’s also assume that they have acquired 2,000 new customers during the year, growing their total customer base to now 12,000.
Given this information, there are three approaches to calculating this formula – with only one approach being the correct method to calculate the average customer retention cost.
- $1m (retention costs) /12,000 (total customer base) = $83 (INCORRECT)
- $1m (retention costs)/ 11,000 (average customer base in the year) = $91 (INCORRECT)
- $1m (retention costs)/ 10,000 (retained customers only) = $100 (CORRECT)
As you can see, selecting the wrong customer base metric, there is a real danger in understating average customer retention costs, which will probably make quite a significant difference in the final CLV number – which may lead to an over-investment in some marketing activities.
Up-selling campaigns are also part of retention costs in CLV
Do not be confused by the term “retention costs”. As per our marketing goals, we also want to grow customer revenues and share-of-customer. A firm will do this through a combination of: direct marketing, sales promotions, new products, price incentives, personal selling and so on.
These customer “up-sell” campaigns are also classified as retention costs in the customer lifetime value calculation. Probably the easiest way to think about is:
Retention costs are any marketing investments targeted at existing customers.
UP-SELLING CAMPAIGNS SHOULD RESULT IN INCREASED CUSTOMER REVENUE
If a firm invests in a major up-selling marketing program, then it is likely that this will be reflected in increased customer revenues. Please refer to the following graph.
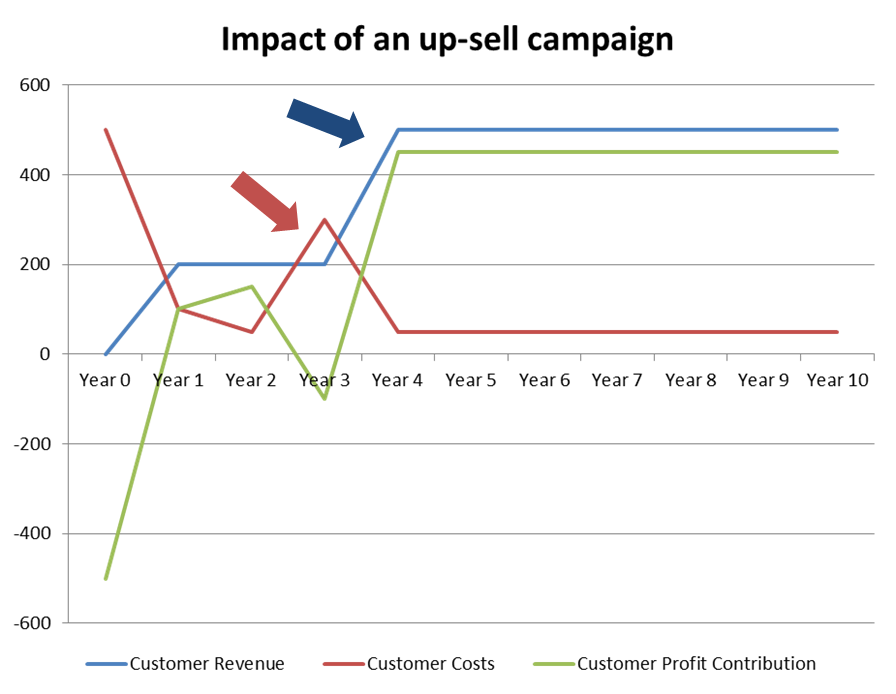
As you can see (red arrow), in year 3 there is a jump in customer retention costs, which is due to a major up-selling (or cross-selling) promotional campaign. This had the resultant effect of reducing the average customer profit contribution to a negative (loss) for that year.
However, this campaign was quite effective resulting in a major increase in customer revenues and profit contribution from year 4 onwards.
AVERAGE RETENTION COSTS SHOULD BE LOWER THAN AVERAGE ACQUISITION COSTS
As a rough rule of thumb, retention costs are generally lower than average acquisition costs, as it is considered more cost-effective to retain an existing customer than to acquire a new one. Please review this Google books excerpt on the loyalty effect.
Retention rate over time
What is the impact of retention rates over time in the customer lifetime value calculation?
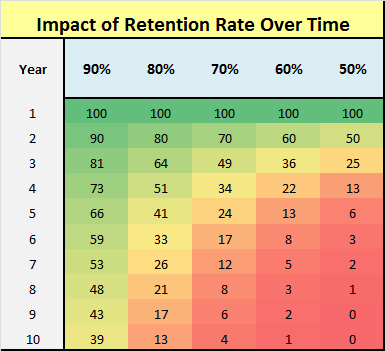
Even at a relatively high retention rates, because of the compounding effect – where the brand keeps losing customers from a reducing customer pool – even with relatively high levels of loyalty, there are very few customers left after 10 years and even after just five years.
As shown in the following table, with a retention rate of 70% or less, a brand will have a very small percentage of long-term retained customers at the end of 10 years. And as you can see from the table, even after five years it takes a 90% retention rate to hold at lest half your customers over that period. The declining cumulative customer retention rates shown in this table highlights the importance of new customer acquisition and efforts to keep customers longer, in order to enhance customer lifetime value.
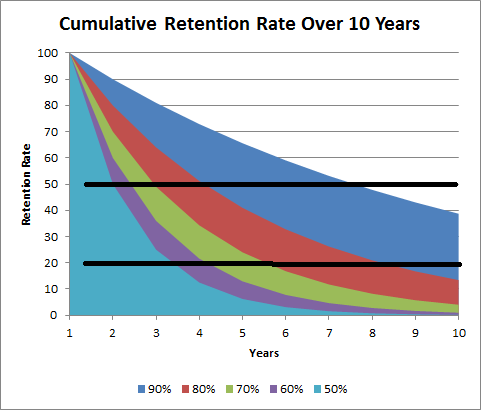
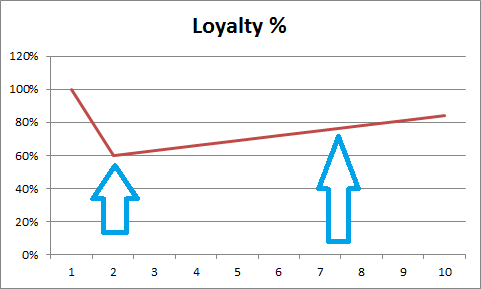
Cumulative retention rates in graph form
Information from the above table has been graphs below. The two black lines represent to the percent in the 20% overall retention rate. Perhaps it is somewhat surprising to see how quickly the overall customer base will fall, particularly at retention rate of 70% or less
Related Topics
Why customer retention should naturally increase over time
Customer retention rate should increase over time
One of the major impacts on overall customer lifetime value (CLV) is the firm’s ability to retain customers. An increased loyalty rate can substantially increase the average lifetime period of the customer, resulting in a significant increase in customer lifetime value.
However, it is unlikely that any cohort of customers will have a static retention rate. It is likely that retention will increase over time. You should note that the free template provided on this website to calculate customer lifetime value, allows you to modify the retention rate each year.
Obviously, for most firms/brands there is a natural goal to increase retention rate – but this will happen automatically in most cohorts of customers.
Example of increasing retention rate
Let’s assume we have acquired 100 customers in a particular year. Upon their first/early experiences with the firm/brand, they will go through some “customer satisfaction” (post purchase) evaluation. As you probably know, this is aligned to their expectations prior to purchase.
 Let’s assume that 25% of these new 100 customers are relatively dissatisfied with their purchase, with the remaining 75% relatively satisfied with their purchase.
You would probably guess that many of the 25% dissatisfied customers are unlikely to continue as customers into the second year – and you can probably also guess that a significant proportion of the 75% satisfied customers will remain loyal to the firm/brand.
If we enter the second year, say with a 60% retention rate – with all of these retained customers being part of the original satisfied group – therefore we held 60/75 of these satisfied customers and we lost all 25 dissatisfied customers.
Therefore, as we enter year three, we only have generally satisfied customers. While we had a 40% churn/loss rate in the first year – due to a proportion of new acquired customers being dissatisfied – they have left the firm/brand – and will not impact the retention rate of this customer cohort into year three.
This will mean that we are likely to see a significant jump in retention rate for this customer cohort – perhaps up to 80%. This process likely to continue, with the quite satisfied customers continuing and the less satisfied customers being more likely to drop off. Over time, the firm/brand should be left with a small, but loyal and quite satisfied, customer base – where retention keeps increasing.
Converting Retention Rate to Customer Lifetime Period
From Retention Rate to Customer Lifetime (in years)
When calculating customer lifetime value using the simple formula, one of the key components is the average number of years that the customer (or the average customer within that segment) will remain a customer of the firm/brand.
Without a detailed customer analysis that extends back in time, it is often difficult to estimate customer lifetime in years. Obviously, a relatively new business will generally only have broad assumptions in this regard.
Loyalty or retention rate however, it is much easier to determine – as you simply compare the numbers of customers dealing with you in year one and see what percentage continued as customers in year two. This is also relatively easy to calculate on a segment basis as well.
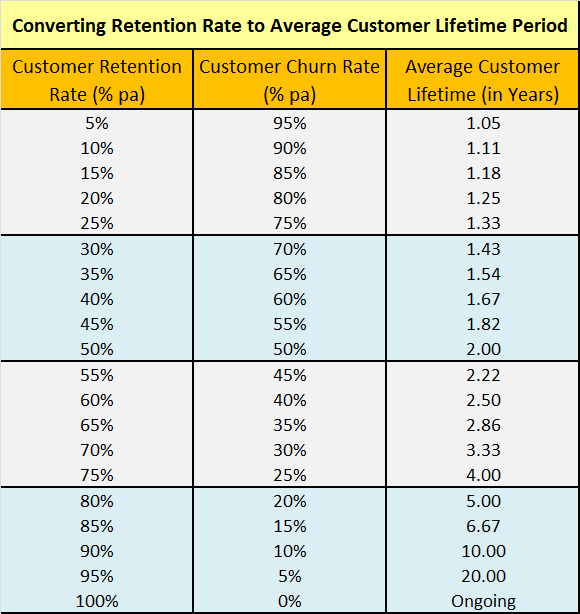
Once we have a loyalty/retention rate, it is very easy to calculate the average customer lifetime in years. The customer lifetime value template available on this website does this automatically and relies upon the input of the retention percentage rate. There is also a quick ready reckoner in the table below that converts customer retention rate to lifetime in years.
The conversion formula is quite straightforward, as follows:
1 divided by Churn (loss) rate %
(Where the Churn (loss) rate % = 1 – Loyalty rate %)
An example of converting the customer retention rate to the average customer lifetime period
If a firm has a 60% loyalty rate, then their loss or churn rate of customers is 40% (Note: These two rates always add to 100%.)
Customer lifetime value period can be calculated as 1 /40% = 2.5 years.
In this case, the average customer remains a customer of the firm/brand for 2.5 years. Keep in mind that some customers will remain for many, many years, while others will be very short term customers.
Reference table for converting customer retention rate to customer lifetime period in years
Related topics
The quick way to calculate average lifetime period
Using the retention rate to calculate average lifetime period
When calculating customer lifetime value (CLV), one of the key inputs is the number of years that the average customer will purchase from the firm. This is surprisingly easy to calculate if you know the loyalty/retention rate of customers.
The formula for average lifetime period of customers is simply 1/(1-retention rate). Please note that this works perfectly for fixed retention rates, otherwise see this article on calculating the customer lifetime period for fluctuating retention rates (which would be the norm in a real business).
You should know that the opposite to the retention (or loyalty) rate is called the churn rate – which is the percentage of customers that are lost in the time period.
For example, an 80% loyalty/retention rate means that 20% of customers are lost (churned). And a 60% loyalty/retention rate means that 40% of customers are lost/churned. In all cases, the retention and the churn rate should add up to 100% to account for all the customers.
If we relook at the above formula for average lifetime period, then it could be further simplified as 1/churn rate. And if we convert the churn rate to a simple fraction, then we can quickly work out the average lifetime period as follows:
20% churn rate = 1/5 = average lifetime period = 5 years
33% churn rate = 1/3 = average lifetime period = 3 years
50% churn rate = ½ = average lifetime period = 2 years
Hopefully what you should notice, is when we convert the churn rate to a simple fraction – where we have 1 as the numerator (top number), we can simply take the bottom number (the denominator) as the number of years.
This occurs because, as we divide the fraction into one, the calculation has the impact of inverting the fraction.
Therefore, if you remember your approach to dividing fractions, you should be able to work out the average lifetime period for any fraction – by inverting the fraction. And you may recall from mathematics, that to divide a fraction you turn it over and multiply it. Because we are dividing into one, we end up multiplying by one – so all we have to do is invert the fraction.
For example, if we have a 30% churn rate, as a fraction that is 3/10. When we invert that we get 10/3 – which is equivalent to 3.33 years.
Likewise, if we have a 40% churn rate, that is equivalent to 2/5 – we then invert it and get 5/2, which is equal to 2.5 years.
Acquisition vs Retention Costs
Acquisition vs Retention Costs in the CLV Calculation
As you can probably gather from the articles on customer acquisition and retention costs, the challenge for most companies would be to split and proportion their various marketing costs between customer acquisition and customer retention activities to customers. The task facing a marketing area to try and estimate the proportion of expenditure allocated to each area.
Three Main Marketing Objectives
Typically the majority of a marketing budget would be allocated with three main intentions, namely:
- Costs to attract new customers
- Costs to retain existing customers
- Costs to up-sell/cross sell to existing customers (increase average customer revenue)
While the marketing budget would be executed across the full marketing mix – product development, pricing incentives, people, process, promotion, and so on – the intention of all of these strategic and tactical decisions is to create and build a large customer base that provides ongoing value to the firm.
Therefore, to effectively and accurately measure customer lifetime value, the overall marketing investment (which may even fall outside of the marketing budget) needs to be allocated across the goals of customer attraction, customer retention and customer up-selling.
In a large firm/brand, it is likely that the same marketing tactic could have multiple intentions. For example, a short-term discount (that is, a sales promotion) would have the effect of attracting first-time customers, increasing the loyalty/retaining existing customers, as well as getting existing customers to buy more. Therefore, in this case, it would be necessary to allocate the costs of this sales promotion to both new/first-time customers (which feeds into customer acquisition costs) and to retention and up selling (which is also necessary to measure in the more complex customer lifetime value formula).
Potential marketing investment area
ADVERTISING
This will need to be proportioned between acquisition and retention/up selling costs. Advertising will impact existing customers, as well as attract new customers. Basic reminder advertising is probably mostly a customer retention cost, whereas special offers and new products tend to have more of a balance between new and existing customers.
SALES PROMOTIONS
Sales promotions should be considered a mix of acquisition and retention costs. Existing customers are attracted purchasing more of a brand/product that they normally buy because of the deal/offer provided. Likewise, non-customers of the brand are also more likely to purchase because the product represents increased value during the sales promotion period.
SPONSORSHIPS
Sponsorships are typically a retention cost as they are designed to help build the brand’s likeability and its association with the event/venue/team. However, it is likely to have a slight impact in reaching hard to reach markets and increasing awareness to some market segments – as a result, a proportion of sponsorship should be allocated customer acquisition costs.
DIRECT MARKETING
Direct marketing is relatively easy to allocate as the intended customer is known – whether they are new or an existing customer.
PUBLIC RELATIONS/PUBLICITY
Like sponsorships above – media relations, publicity, newsletters and hospitality – all tend to primarily have an existing customer focus and would often be male considered a retention expense. But like sponsorships, a proportion of this expenditure should be allocated to customer acquisition.
CORPORATE EVENTS
Depending on upon the focus of the event, it should be relatively easy to allocate the cost of events between customer acquisition and customer retention. Some events are primarily for existing/loyal customers, whereas others are primarily designed to attract new business.
NEW PRODUCTS
New products give the opportunity to firms to sell more products to their existing customer base. A firm with a strong brand (that is, customer following) will often target existing customers with their new products. However, new products are also designed take business away from competitors and to grow market share and/or expand market coverage. As a result, a proportion of new product expenditure should also be allocated to customer acquisition costs.
SOCIAL MEDIA CAMPAIGNS
As with advertising discussed above, the cost of social media campaigns needs to be allocated between customer acquisition and customer retention, depending upon its intended purpose. Google Analytics can be quite helpful in identifying the impact of social media between new and returning users to the firm’s website.
NEW STORES OR RETAILERS
If a company opens a new store, or expands into new retailers, then it is likely that they will attract new customers as a result. Therefore, a significant proportion of this cost can be considered to be a customer acquisition cost.
SALES FORCE COSTS
Sales force expenditure costs and commissions (either internal to the company or through third party suppliers) should be relatively easy to allocate. Often companies structure their sales force into new business and existing clients. And usually the commission structure clearly identifies new business sales versus repeat business sales.
CUSTOMER SERVICE STAFF
The majority of customer service staff costs should be allocated to retention and up-selling. Customer service staff help facilitate the service and provide information and are less likely to be involved in initial selling. On occasion, say in a retail setting, customer service staff would have a dual role of service and selling and this needs to be taken into account in calculating customer acquisition costs to feed into the overall customer lifetime value formula.
WEBSITE AND ONLINE COSTS
Depending on the company, some websites are predominantly designed for existing customers – an example here would be a banking internet site- whereas other websites are predominantly sales sites, such as online retailers. Again Google Analytics can assist in this regard, as it measures first-time and repeat users (visitors). This can provide a guide to the allocation of website/online costs between customer acquisition and customer retention.
SUPPLY AND INSTALLATION OF EQUIPMENT
Obviously the majority of equipment supplied and installed would be for new customers.
However, a small proportion could also be for existing customers as they increase their relationship with the firm. An example would be an office adding an additional water cooler (from a water delivery company) as they have expanded their staff numbers – thus requiring additional equipment.
PROPOSALS/TENDERS
The vast majority of proposals and tenders would be targeted at winning new business. However, on occasion, the firm may be required to “pitch” to an existing customer/client. An example here would be an advertising agency trying to re-win the business of a business client.
MARKET RESEARCH AND DATABASE ANALYSIS
To accurately determine customer lifetime value, it is necessary to consider all costs associated with the customer, including information and software costs. The majority of analysis is associated with existing customers and should be allocated to retention costs, with a minority being allocated to new business – particularly for research into new market segments.
How to calculate customer lifetime period with a fluctuating retention rate
Customer lifetime period
This is the amount of time that the average customer (or customer segment) remains an active customer with a firm; it is typically measured in years.
When a business has a very stable customer retention rate every year, regardless of the length of loyalty of the customer base or improvements and modifications to customer acquisition and retention – then the calculation of the customer lifetime period is very straightforward using a set formula, which is discussed in this article on calculating the customer lifetime period.
Fluctuating customer retention rates
In business reality, it is unlikely that the retention rate = customer loyalty – will remain constant each year. There are several factors why this is the case, such as:
- Different marketing campaigns and incentives bring in new customers with likely different loyalty patterns over time
- The company itself will try to build and enhance loyalty over time, by improving service or through loyalty incentives
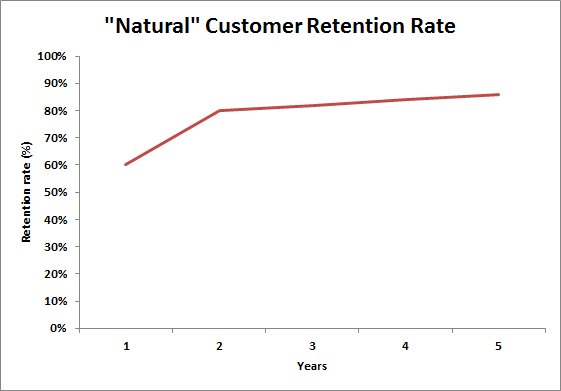
But most importantly, customers who remain loyal for one year or more appear to have a good degree of satisfaction with the firm. In other words, dissatisfied customers are more likely to churn within the early stages of their relationship. The following diagram highlights the most likely pattern of customer loyalty and retention over time for most firms:
As you can see, there is a 60% retention rate from year 1 to year 2, which gradually increases to over 80% over time. This is a relatively typical pattern of customer loyalty to the factors outlined above.
Calculating the customer lifetime period with a increasing retention rate
As there are different retention rates to consider for each year of the customer relationship, we can no longer use the formula (please see the article link above) and we need to do a manual, but simple, calculation.
Let’s review the following table:
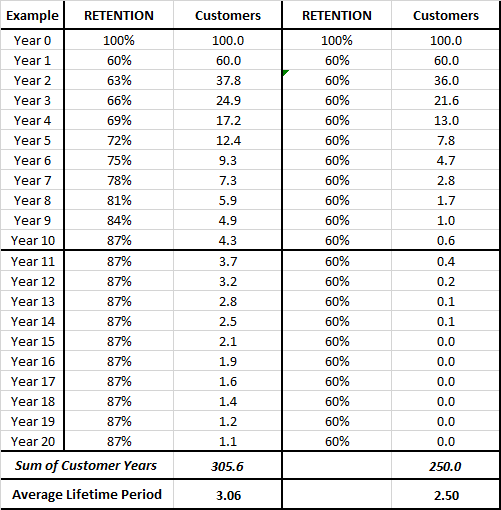
There is to example shown above. On the left-hand side we have a firm that has increasing retention rate – starting at 60% in the first year, but then increasing progressively to 87% by the end of year 10.
For the simplicity of the calculation, I have assumed that 87% is the maximum retention rate that will be reached. As you can see, by the end of year 20, the firm is only likely to have 1 customer remaining out of 100.
The key calculation occurs in the “customers” column, where we start with a set of 100 customers and then apply the loyalty percentage progressively to work out how many customers we expect to have remaining the following year.
For example, in year one we have a 60% retention = 60 out of 100 customers. In the following year, the retention rate increases to 63%, which means that we will have 63% of the remaining 60 customers = 37.8 customers.
Please note the decimals are used as this is a forecast of likely customers (like a probability measure) – obviously we can’t have 0.8 of the customer.
We continue the calculation down for the full 20 years – or a suitable time period for the business involved, which may be shorter. And then we sum that column of numbers.
In this example, the sum is 305.6 years. This equates to 305.6 total customer years across the 100 customers that we started with. Then we simply divide 305.6 total years by the starting 100 customers, we get an average customer lifetime period of 3.056 (or 3.06 rounded).
The example shown in the other columns on the right, are calculated the same way – except this time with a flat retention rate, to demonstrate that the calculation is correct.
If we have a flat 60% retention rate, then our churn/loss rate is 40% – and using the formula we can determine that the average customer lifetime value period is 2.5 years.
Lifetime period = 1/(1 – retention rate) = 1/(churn rate)
For this example, the lifetime period is 1/0.4 = 2.5 years – which is a match to the above calculated table.
Helpful instructional video on the above table
https://www.youtube.com/watch?v=nlfTbVzVZJ8&feature=emb_title&ab_channel=MarketingStudyGuide